

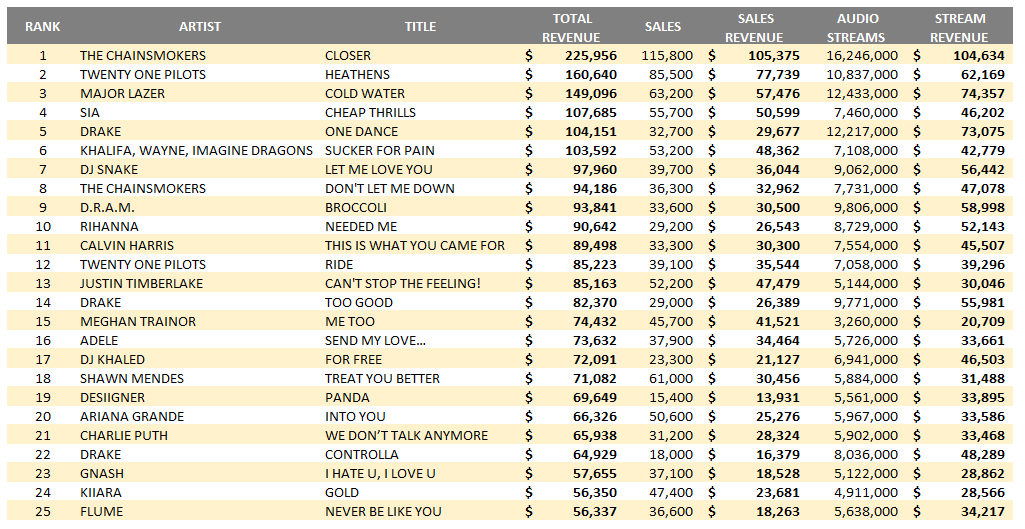
Chart News: Revenue chart (wk ending 8/18): Closer #1
 |
|
Quote:
|
To reiterate, the chart below tracks the total weekly revenue of the Top 25 songs, tabulating sales, streams and their revenue contributions. A word about methodology: On-demand audio streams are calculated at an average of .00575 per stream; however, streams from the ad-supported tier are calculated at a lower rate. Track sales are calculated at 70% of retail, with 69-cent and other discount sales pricing factored in. Revenue from video streams, including user-generated content, is factored into the total but not broken out on the chart. Needless to say, these numbers represent an estimate for comparative purposes, and should not be seen as an attempt to determine artist royalty payments. Got that? No? Great. |
[x]